
Understanding Gantt Chat
In our fast-paced, work-driven world, effective project management is key. Whether it’s upgrades to existing software, launching a marketing campaign, or implementing a new HR strategy, every business initiative is essentially a project that needs to be managed. For effective project management, many have turned to the usage of Gantt charts, a popular and highly beneficial tool. In this article, we’re taking an in-depth look at this powerful resource for project managers.
The Underlying Principles of the Gantt Chart
At its core, a Gantt chart is a visual view of tasks scheduled over time. This graphical representation of a project’s schedule, named after engineer Henry Gantt, is designed to denote the start and end dates of a project’s constituent tasks. This schedule management tool represents the timeline of the project, with each task as a bar on the timeline. It showcases the interdependence of tasks and can be manually or digitally created depending on user preference or project complexity.
A critical distinguishing feature of the Gantt chart is that it offers a holistic view of the progress of numerous tasks simultaneously. Imagine trying to juggle all the aspects of a complex project without such a guidance framework. The Gantt chart acts as a roadmap, guiding the project team on where to focus their energies and when. This is vital for maintaining the efficient utilization of resources and adherence to the set timeline.
Understanding the basic principles behind a Gantt chart is the first step to leveraging them effectively. By visually displaying important delivery dates, sequencing events, and displaying progress toward project completion, Gantt charts provide a comprehensive and accessible view of the project’s status. This aids communication within the team, ensures project alignment with strategic objectives, and allows project managers to quickly and efficiently identify any potential issues or delays.
Anatomy of a Gantt Chart
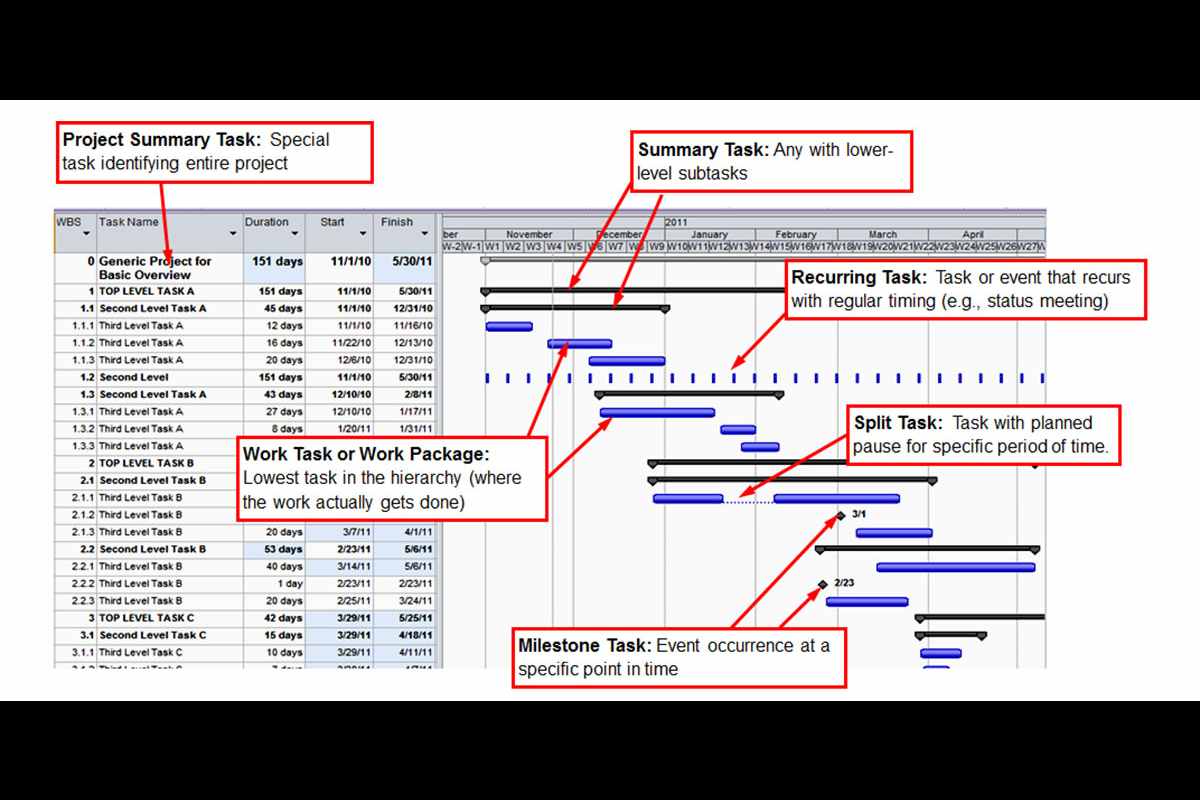
Basic Gantt charts consist of a few key components: a data grid, tasks, and a timeline. Additionally, depending on its sophistication, it can also include task relationships, the current date line, and progress lines. Understanding each one is essential for creating and interpreting a Gantt chart effectively.
The data grid in a Gantt chart contains crucial information such as the task name, the task start date, its duration, and who the task is assigned. It offers a high-level overview of all the tasks in the project and their respective timelines. Often, this section of the chart houses other relevant details such as task descriptions, task identifiers, or any resources linked to the tasks.
The timeline is positioned based on the duration of each task. Project managers can decide on the unit of measurement that most accurately reflects their project needs, ranging from minutes to months, even years, if necessary. Apart from showing the task length, it also indicates the task’s start and end dates, hence providing a clear temporal mapping for the duration of the project. This aids in setting realistic timelines and adequately managing resources, thereby upping the project success ratio.
Task relationships, or dependencies as they’re sometimes called, are particularly helpful for illustrating how tasks are interconnected. They help enforce the order of operations and prevent tasks that rely on one another’s completion from overlapping. In simple terms, it helps avoid the initiation of a task until its predecessor task is completed to prevent workflow bottlenecks
The Versatility of Gantt Charts

A Gantt chart is a versatile tool that can be adapted and manipulated to represent various kinds of data based on the project’s requirements. This notion of flexibility aids in project execution across multiple business sectors, from building a website to machinery setup in manufacturing plants.
Project managers use Gantt charts not only as project planners but also as resource planners, risk management tools, and for budget planning. With these expansive applications, the relevance of a Gantt chart expands beyond the core project management realm and into the wider business environment.
A significant advantage of a Gantt chart and a reason behind its extensiveness is the ease with which it conveys complex data. Even large-scale projects with hundreds of tasks can be translated into a concise visual representation. This allows teams to understand quickly what work is required to complete a task, who is accountable for delivering it, and when it needs to be completed.
The Gantt Chart is an incredibly useful tool for project management, providing a visual representation of a project’s timeline and progress. Its versatility, simplicity of interpretation, and adaptability to digital advancements have solidified its importance in project management. Gantt charts increase team collaboration and contribute to employee satisfaction. As we deal with increasingly complex projects in our evolving digital world, the need for efficient project management tools like the Gantt chart shows no signs of diminishing.